

Measuring a Loudspeaker Impedance Profile
Objective
The objective of this experiment is to measure the impedance profile and the resonate frequency of a permanent magnet loudspeaker.
Notes
In this tutorials we use the terminology taken from the user manual when referring to the connections to the Red Pitaya STEMlab board hardware. Impedance analyzer application is used to measure RLC circuit impedane \(Z(f)\). Here we use Impedance analyzer application without LCR meter frontend as described HERE. The Impedance analyzer application enables measurements of Impedance, Phase and other parameters of the selected DUT (Device Under Test). Measurements can be performed in the Frequency sweep mode with 1Hz frequency resolution or in the Measurements sweep mode with the desired number of measurements at constant frequency. The selectable frequency range is from 1Hz to 60MHz, although the recommended frequency range is up to 1MHz. The impedance range is from 0.1 Ohm to 10 Mohm. When using the Impedance analyzer application with the LCR Extension module, insert 0 in the shunt resistor field.
Background
The chief electrical characteristic of a dynamic loudspeaker is its electrical impedance as a function of frequency. It can be visualized by plotting it as a graph, called the impedance curve. The most common type of loudspeaker is an electro-mechanical transducer using a voice coil connected to a diaphragm or cone. The voice coil in moving coil loudspeakers is suspended in a magnetic field provided by a permanent magnet. As electric current flows through the voice coil, from an audio amplifier, the electro-magnetic field created by the current in the coil reacts against the permanent magnet’s fixed field and moves the voice coil (also the cone). Alternating current will move the cone back and forth. The movement of the cone vibrates the air producing the sound.
The moving system of the loudspeaker, including the cone, cone suspension, spider and the voice coil, has a certain mass and compliance. This is most commonly modeled as a simple mass suspended by a spring that has a certain resonant frequency at which the system will vibrate most freely.
This frequency is known as the “free-space resonance” of the speaker and is designated by \(F_S\). At this frequency, since the voice coil is vibrating with the maximum peak-to-peak amplitude and velocity, the back-emf generated by coil motion in a magnetic field is also at its maximum. This causes the effective electrical impedance of the speaker to be at its maximum at \(F_S\), known as \(F_{max}\). For frequencies just below resonance, the impedance rises rapidly as the frequency approaches \(F_S\) and is inductive in nature. At resonance, the impedance is purely resistive and beyond it, as the impedance drops, it looks capacitive. The impedance reaches a minimum value, \(Z_{min}\), at some frequency where the behavior is mostly (but not perfectly) resistive over some range of frequencies. A speaker’s rated or nominal impedance, \(Z_{nom}\), is derived from this \(Z_{min}\) value.
Knowing the resonate frequency and the minimum and maximum impedances are important when designing cross over filter networks for multiple driver speakers and the physical enclosure the speakers are mounted in.
Loudspeaker Impedance Model
To help understand the measurements you are about to make, a simplified electrical model of a loudspeaker is shown in figure 1.
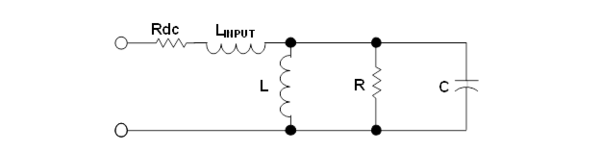
Figure 1: Loudspeaker Impedance Model
The circuit in figure 1 has a dc resistance placed in series with a lossy parallel resonant circuit made up of \(L\), \(R\), and \(C\), which models the dynamic impedance of the speaker over the frequency range of interest.
- \(R_{dc}\) is the dc resistance of the loudspeaker as measured with a DC ohmmeter. The dc resistance is often referred to as the \(DCR\) in a speaker/subwoofer data sheet. The dc resistance measurement is usually less than the driver’s nominal impedance \(Z_{nom}\). \(R_{dc}\) is typically less than the specified loudspeaker impedance and the novice loudspeaker enthusiast may be fearful that the driver amplifier will be overloaded. However, because the inductance \(L\) of a speaker increases with an increase in frequency, it is unlikely that the driver amplifier actually sees the dc resistance as its load.
- \(L\) is the voice coil inductance usually measured in milliHenries \(mH\). Typically, the industry standard is to measure the voice coil inductance at \(1kHz\). As frequencies increase above \(0Hz\), there is a rise in impedance above the \(R_{dc}\) value. This is because the voice coil acts as an inductor. Consequently, the overall impedance of a loudspeaker is not a constant impedance, but can be represented as a dynamic profile that changes with input frequency as we will see when we make measurements. Maximum impedance, \(Z_{max}\), of the loudspeaker occurs at the resonant frequency, \(F_s\), of the loudspeaker.
- \(F_s\) is the resonant frequency of a loudspeaker. The impedance of a loudspeaker is a maximum at \(Z_s\). The resonant frequency is the point at which the total mass of the moving parts of the loudspeaker become balanced with the force of the speaker suspension when in motion. The resonant frequency information is important to prevent an enclosure from ringing. In general, the mass of the moving parts and the stiffness of the speaker suspension are the key elements that affect the resonant frequency. A vented enclosure (bass reflex) is tuned to \(F_s\) so that the two work in unison. As a rule, a speaker with a lower \(F_s\) is better for low-frequency reproduction than a speaker with a higher \(F_s\).
- \(R\) represents the mechanical resistance of a driver’s suspension losses.
Materials
- Red Pitaya STEMlab 125-14 or STEMlab 125-10
- Resistor - \(R_{shunt}\): 10 Ω
- Loudspeaker, it is best if the speaker is one with a cone diameter larger than 10cm such that is has a relatively low resonant frequency.
Procedure
- First build the circuit shown in the figure 1 and figure 2. The loudspeaker can be in an enclosure or not.
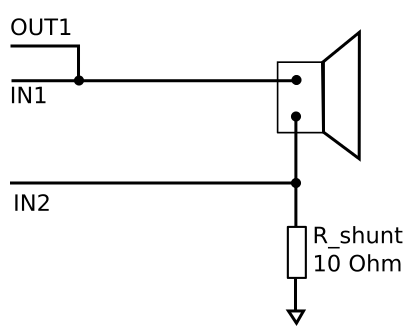
Figure 2: Loudspeaker connections
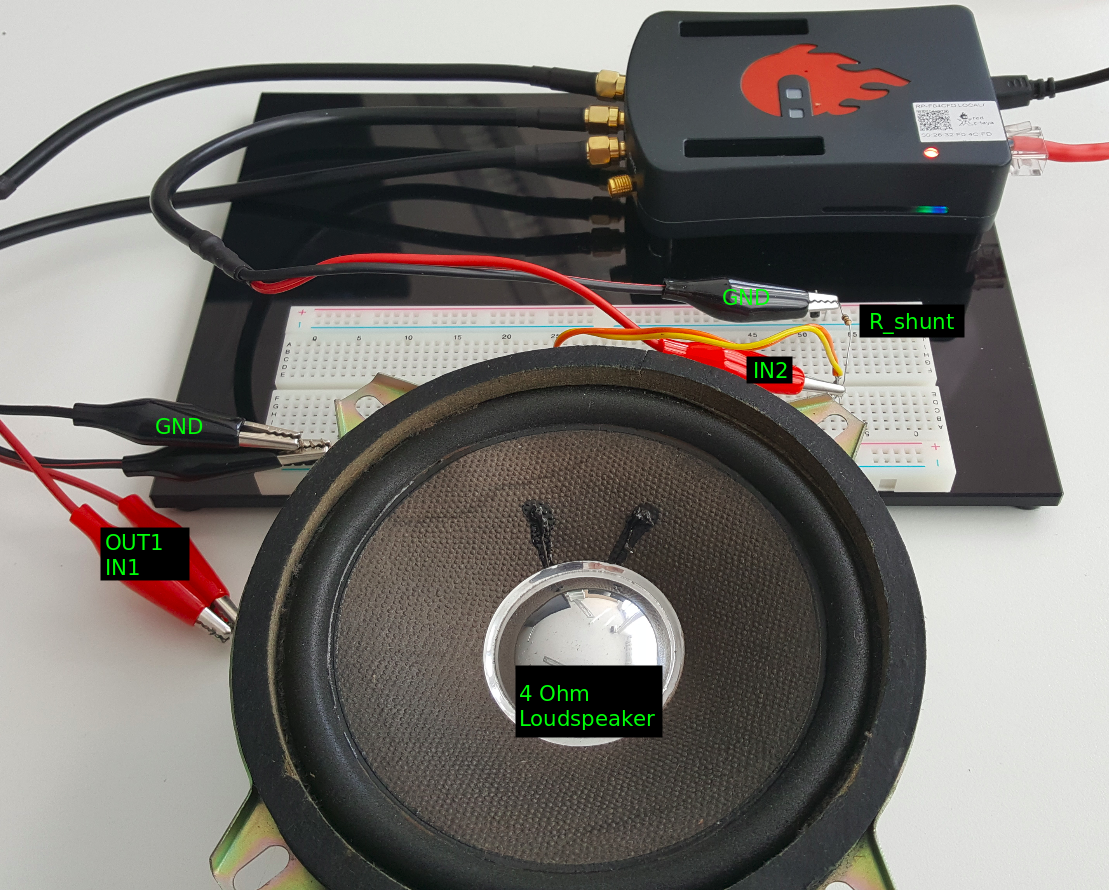
Figure 3: STEMlab with shunt resistor Impedance analyzer conection and Loudspeaker
- Start the Impedance analyzer application.
Note
Impedance analyzer is community application and it needs to be downloaded from Application marketplace (bazaar). Click on Application marketplace icon and select Install for Impedance analyzer.
- Start Impedance analyzer and:
- under Measurement settings menu set number of steps: 30
- under Measurement settings menu set \(R_{shunt}\) value to \(10 \Omega\)
- under Frequency sweep set Start frequency to 10Hz and End frequency to 10kHz
- select Start measurement
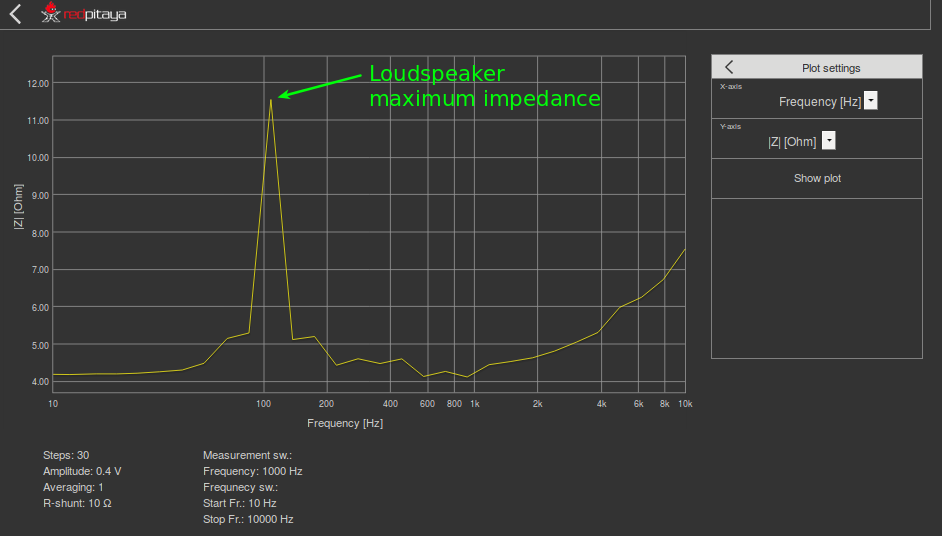
Figure 4: Graph of the Loudspeaker impedance magnitude taken with Impedance analyzer application
- 4.Plot mesured Phase
- under Plot settings menu for Y-axis select P[deg]
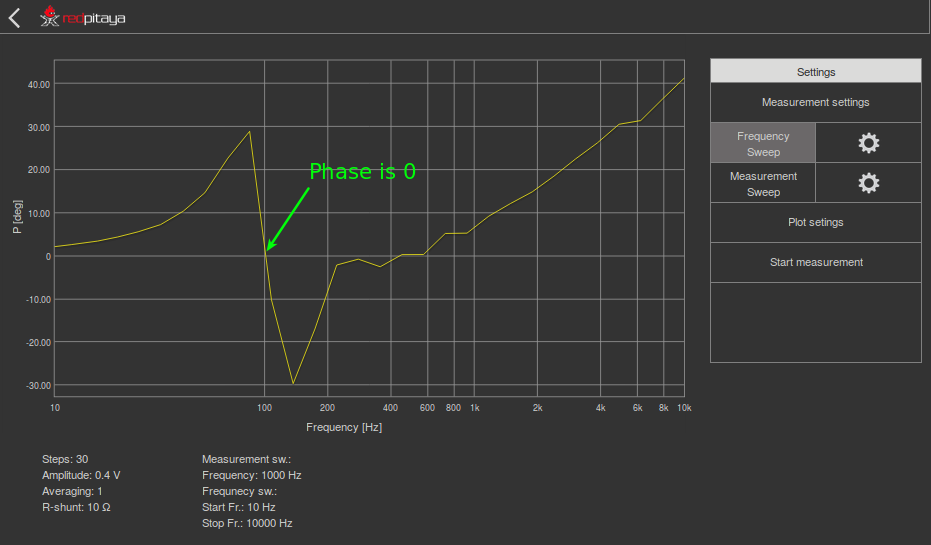
Figure 5: Graph of the Loudspeaker impedance phase taken with Impedance analyzer application
Note
The frequency at which this occurs (Phase = 0) is called resonant frequency.
As is shown in Loudspeaker model (figure 1) resistance \(R\) represent the mechanical resistance of a driver’s suspension losses. To see an effect of this modeled resistance \(R\) flipover Loudspeaker so its membrane is facing working bench. With this we will change acousto-mechanical environment of the speaker which will affect the loudspeaker impedance.
- Flipover Loudspeaker as is shown in figure 6 and repeat Impedance measurements
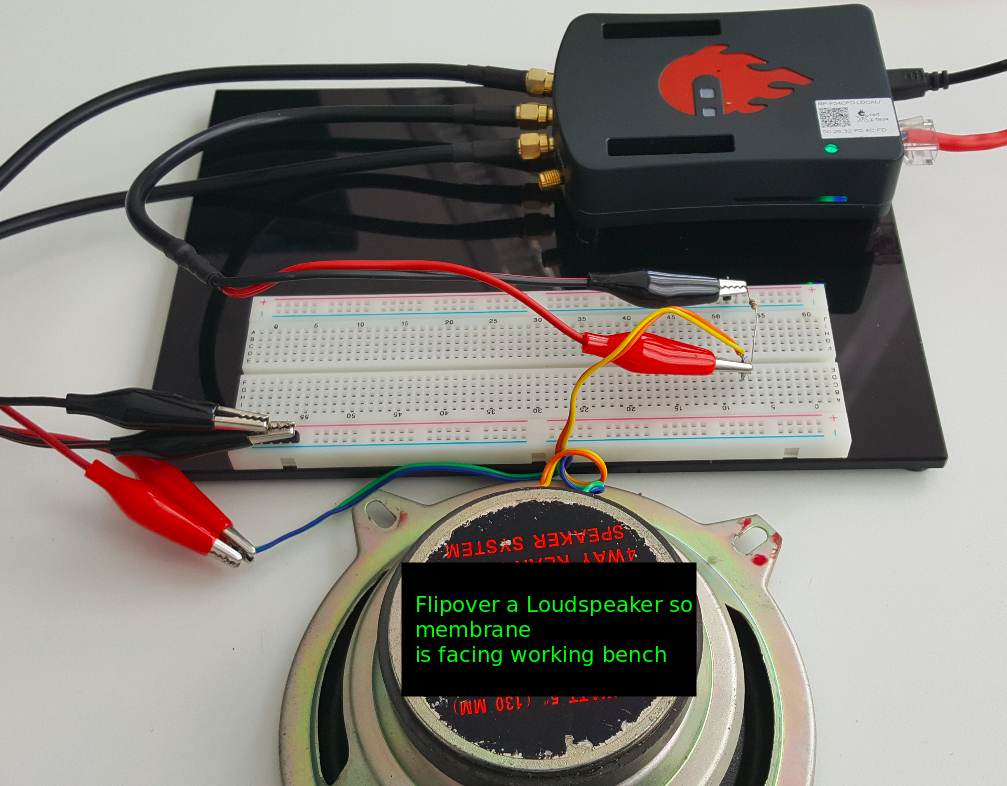
Figure 6: Loudspeaker in different acousto-mechanical environment
As we can see from figure 7 impedance of loudspeaker is now different and effect of acousto-mechanical environment is clearly visible.
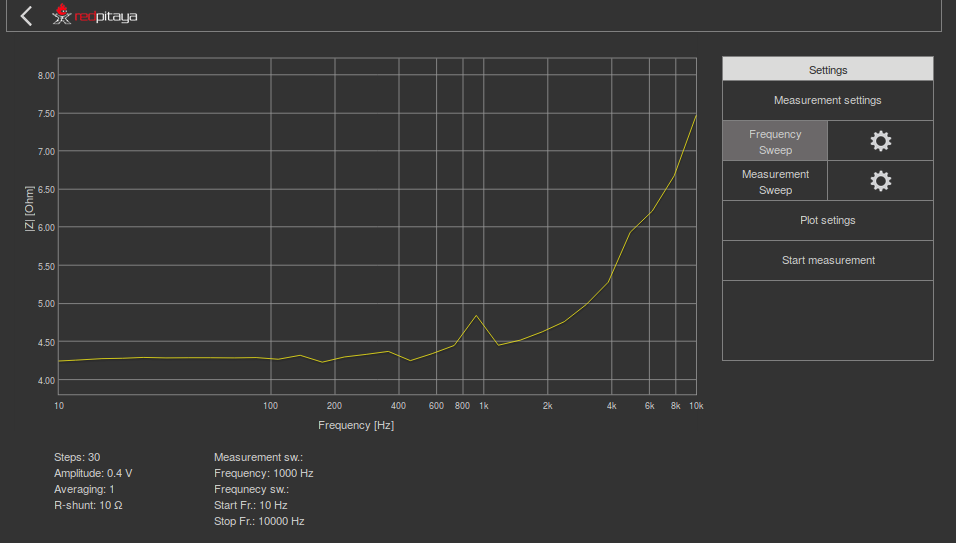
Figure 7: Loudspeaker impedance at different acousto-mechanical environment